BMI is a person’s weight in kilograms (kg) divided by his or her height in meters squared. The National Institutes of Health (NIH) now defines normal weight, overweight, and obesity according to BMI rather than the traditional height/weight charts. Overweight is a BMI of 27.3 or more for women and 27.8 or more for men.
The BMI ranges are based on the effect excessive body fat has on disease and death and are reasonably well related to adiposity. BMI was developed as a risk indicator of disease; as BMI increases, so does the risk for some diseases. Some common conditions related to overweight and obesity include premature death, cardiovascular diseases, high blood pressure, osteoarthritis, some cancers, and diabetes.
BMI is also recommended for use in children and adolescents. In children, BMI is calculated as for adults and then compared with z-scores or percentiles. During childhood and adolescence, the ratio between weight and height varies with sex and age, so the cut-off values that determine the nutritional status of those aged 0–19 years are gender- and age-specific. The cut-off points of the 2006 BMI-for-age reference for children aged 0–5 years for the diagnosis of overweight and obesity were set as the 97th and the 99th percentile, respectively. For those aged 5–19 years, overweight is defined as a BMI-for-age value over +1 SD and obesity as a BMI-for-age value over +2 SD.
History
BMI is very easy to measure and calculate and is, therefore, the most commonly used tool to correlate the risk of health problems with the weight at population level. It was developed by Adolphe Quetelet during the 19th century. During the 1970s and based especially on the data and report from the Seven Countries Study, researchers noticed that BMI appeared to be a good proxy for adiposity and overweight-related problems.
Like any other measure, it is not perfect because it is only dependant on height and weight and it does not take into consideration different levels of adiposity based on age, physical activity levels, and sex. For this reason, it is expected that it overestimates adiposity in some cases and underestimates it in others.
Other measures, such as waist circumference (WC), can complement BMI estimates. Association between WC and health risks is not an easy task and should be done scientifically using proper techniques.
Although the BMI calculation has been around since the 1800s, it gained popularity after a study published in the July 1972 issue of the Journal of Chronic Diseases concluded BMI to be the best proxy for body fat percentage among ratios of weight and height. Epidemiological studies (studies of large populations) often use the BMI to predict the likelihood of a number of diseases. And while BMI may be acceptable to studying groups of people, its application to individuals is limited, as there are numerous significant flaws in using this number, and other, much better options exist.
How To Read The BMI Chart
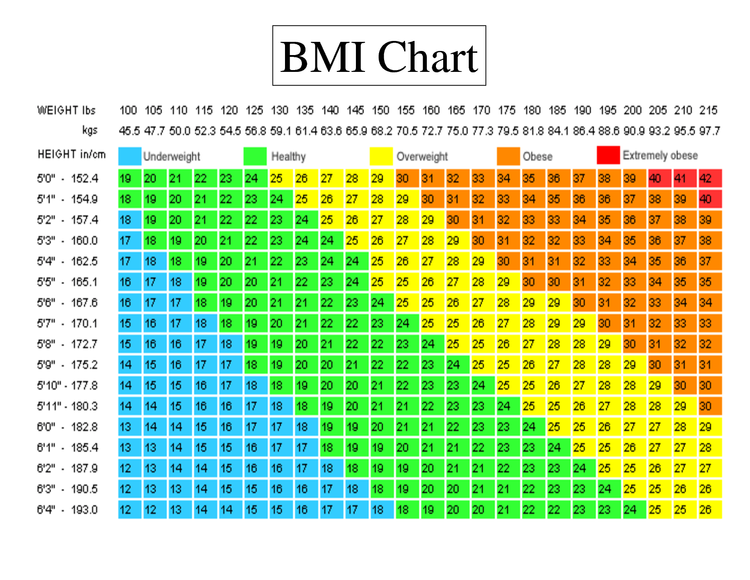
The BMI Chart, which is the featured image in this article displays a range of BMI values for various heights and weights.
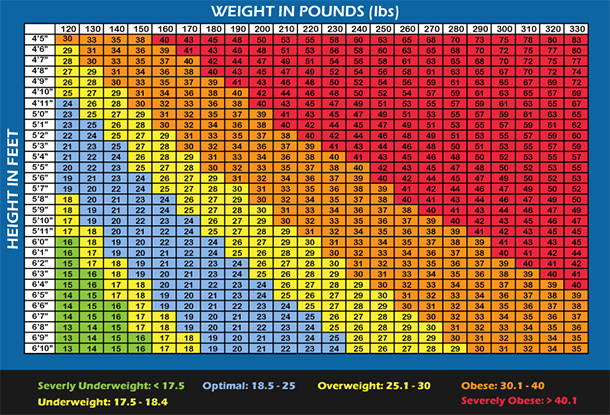
To find your BMI, identify your height on the left column, then use the top row to find your weight, then meet the two points in the graph.
What Does Research Say About The BMI Chart?
A large body of research supports the idea that people with higher BMIs are more prone to a number of health-related complications. A review article published in The Lancet (a very highly respected medical journal) showed a significant increase in cancer with a 5 kg/m2 increase in BMI. Being overweight or obese at age 40 is associated with a significantly increased risk of dying prematurely. BMI predicts diabetes as well as a specialized blood sugar test according to another research article. BMIs over 25 are linked to heart disease and high blood pressure.
Note: Some studies have shown that being underweight is also a risk for premature death, sometimes even more so than being overweight. These studies, however, did not exclude “sick” people, like those with cancer or emphysema, or people who smoke or use dangerous drugs, which often can cause weight loss. There are no studies to my knowledge that show healthy people with desirable body compositions die sooner than overweight people.
Problems With The BMI Chart
All of the BMI studies cited above were done across large populations. Using that data and applying it to an individual without looking at the person’s overall health is a bad idea. BMI calculations do not consider age, gender, frame size, muscle mass, or fat distribution. Subcutaneous fat (under the skin) does not appear to strongly predispose to disease, whereas visceral fat (in and between the organs) does. Therefore, someone can have a normal BMI but a high percentage of visceral fat and be at high risk for diabetes and heart disease but a sumo wrestler, with a high BMI but little visceral fat, will be metabolically healthy. Additionally, as most people know, essentially all NFL running backs, most of whom sport 6-packs and sub-10% body fat would be classified as obese under this system. Even a recreational athlete with slightly above average muscle mass could be considered overweight.
Many doctors calculate the BMI of patients and make recommendations simply based on that number, which is a flawed approach for the reasons given above. In fact, I just saw a patient for physique coaching who was 5’9” and weighed 185 pounds. Despite having a 33-inch waist, 11% body fat, and perfect cholesterol and blood sugar, his primary care doctor told him he must lose 25 pounds if he didn’t want to get diabetes and heart disease!
Better Alternatives to The BMI Chart
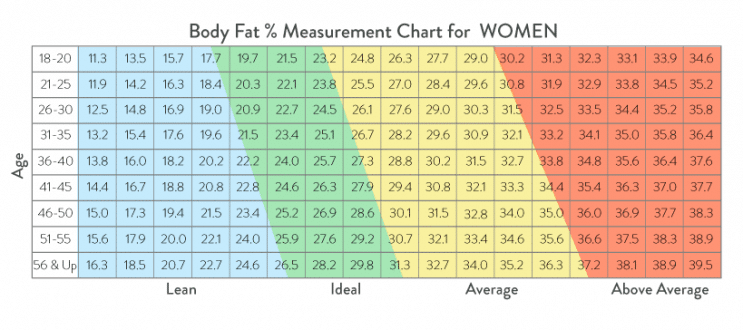
Body fat measurement: While BMI is used as a proxy for body fat, it is a much better idea to just measure body fat. Health is generally better with lower body fat percentages regardless of the BMI, and this includes populations with documented diseases like diabetes.10 I recommend striving for maximum muscle mass and body fat below 15% for men and 23% for women. These numbers are within the “fitness range” of recommended body fat according to the American Council on Exercise. See Top 10 Most Obese Cities In America
Waist to hip circumference: Since it is becoming very clear that the distribution of body fat is an important indicator is disease risk, it makes sense to examine it. People with fat distributed around the abdomen are at higher risk for heart disease and diabetes12 13, so aiming to reduce the ratio is a better idea than trying to reduce BMI. In other words, if you just focus on “losing weight” you may very well end up losing muscle as well and looking like a shrunk-down version of your former self, with the same risk of serious disease as before.
As always, it is important to look at the “big picture” rather than focusing on a particular calculation to evaluate your chances of developing an obesity-related illness. See: Obesity In America


